Guide to Grafana data
All data from the TIMMS is displayed for public view on Grafana and can be viewed at http://www.openscienceassociates.com/delene/Observations.html.
To be edit the Grafana sites get in touch with Delene and have him invite you to edit the Grafana site.
To keep everything as neat as possible we want all our station data pages to look the same.
Each station as two Grafana sites, one for all data (wind,temp,RH,ect.) and one for visibility only.
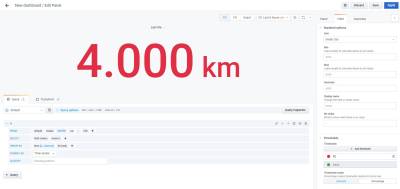
Screenshots from Glacial Ridge are attached below.
 Glacial Ridge visibility data
 Glacial Ridge combined data
Formatting a site
Once the Grafana site has been created you can format it to look like the examples provided. Start by formatting the visibility site.
Visibility
The visibility site consists of three data sets, visibility, extinction coefficient, and Irradiance
you will need for panels per data set. Start by adding one panel to the site. The button is on the top right of the screen as shown in the following screenshot:

- If you do not have an option to add a panel you need to contact Delene so he can invite you to edit the sites.
After adding a new panel to the site you should now see a chart with no data
 Once you are to this step, name the panel “Last Vis.”
- Select Transparent below the panel description to remove the background.
- Under the visualization tab select “stat”. This will switch the panel to numbers rather than a graph.
- In order to display the correct data for the panel you will need to find the corresponding variable. A general rule of thumb is that irradiance is the lowest variable (i.e. 106) followed by Ext. Coeff. (107) and visibility (108).
- To add a variable find the select measurement button in the A group of the Query tab and change it to tsdata.
- next press the plus button on the same line and add a var, set this to the corresponding variable for visibility. There should be data in the panel rather than the “No Data” text.
- To make the panel display a number only and no graph find the graph mode under the display tab and change from “area” to “none”.
- The data for visibility is displayed in meters however we want it in kilometers. To change this go the the field tab and select meters as the unit.
- to change the color of the tab find thresholds under the field tab and delete the threshold associated with the red display color usually it is “80”. Once the threshold has been deleted the graph should be green.
- To configure the panel to always show the last value add “last” from the selector category in the A group of the Query tab.
- Under the Display tab locate the calculation dropdown selector and change it to “Last (not Null)”


Max and Min panels
- Once you have created and formatted the last visibility panel you can create the max and min visibility panels
- duplicate your last visibility panel and scale the new panel to be about half the size of the original panel
- rename the panel “Min. Vis.”
- Change both the calculation under the visibility tab and the selector under the Query tab to min

- To create and format the Max panel repeat the steps above except all “min” data filters to “max” data filter